 Shadow
 Global Left-Handedness Rates: Culture's Profound Impact
The Netherlands leads the world with 12.95% left-handers, while China trails at 2.64%. A global survey of over 400,000 people reveals how culture shapes handedness rates across countries.

The Netherlands reports the highest rate of left-handed individuals globally at 12.95%, while China records one of the lowest at just 2.64%. This significant disparity, nearly a tenfold difference, highlights how cultural factors profoundly influence the expression of handedness across different nations.
Why China Has Ten Times Fewer Left-Handers Than the Netherlands
Left-handedness is a fascinating intersection of biology and culture. While an individual's handedness remains stable throughout their life, the prevalence of left-handers reported by a country can fluctuate dramatically across generations and varies significantly by geography. A comprehensive global survey, part of the Sea Hero Quest project, analyzed data from 422,772 volunteers across 41 countries using a mobile navigation game to map these variations.
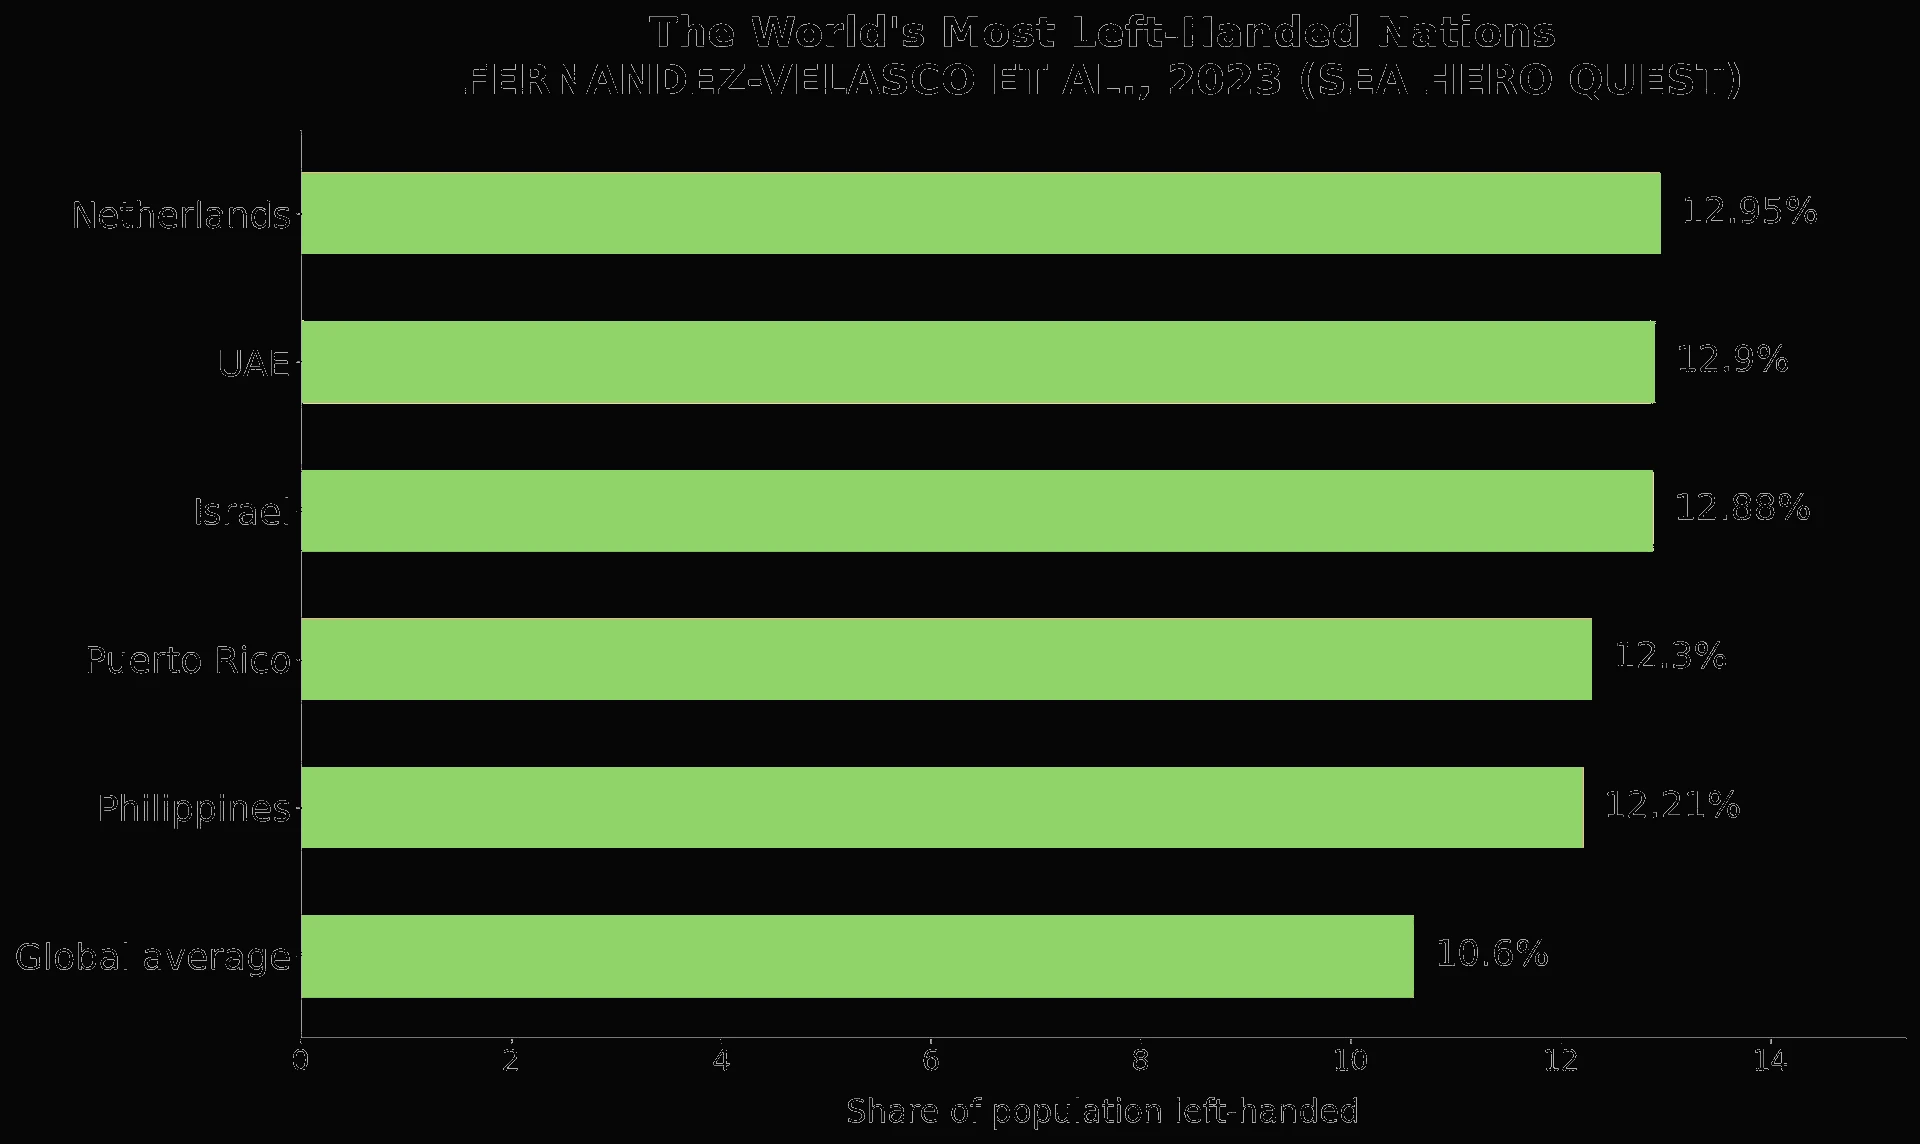
The study identified the Netherlands as the global leader in left-handedness, with 12.95% of its population identifying as left-handed. This figure places it notably above the study's 10.6% global average. The top five nations for left-handedness demonstrate a diverse geographical spread, indicating that high rates are not confined to any single region:
- Netherlands: 12.95%
- United Arab Emirates: 12.90%
- Israel: 12.88%
- Puerto Rico: 12.30%
- Philippines: 12.21%
The United States reported a rate close to the global average, with 10.9% of its population being left-handed. Given the country's population, this translates to approximately 36 million left-handed Americans.
The Least Left-Handed Nations, All in Asia
In stark contrast to the global leaders, the countries with the lowest rates of left-handedness are concentrated in a single region: Asia. China recorded the lowest rate in the study at just 2.64%, less than a quarter of the global average. This represents a nearly fivefold difference compared to the Netherlands, the country with the highest rate.
The five lowest-ranked countries in the study were:
- China: 2.64%
- Indonesia: 3.39%
- Vietnam: 4.26%
- Hong Kong: 4.85%
- Taiwan: 5.16%
Researchers attribute this strong regional pattern to significant cultural pressures towards conformity, alongside decades of rapid industrialization. These factors often led to practices where children were trained to use their right hand, even if naturally left-handed, simplifying tasks in a right-hand-dominant society.

A Rate That Nearly Quadrupled in a Century
While an individual's handedness is fixed, the reported rates of left-handedness have changed dramatically across generations. This shift is not due to biological evolution but rather a change in societal acceptance and practices.
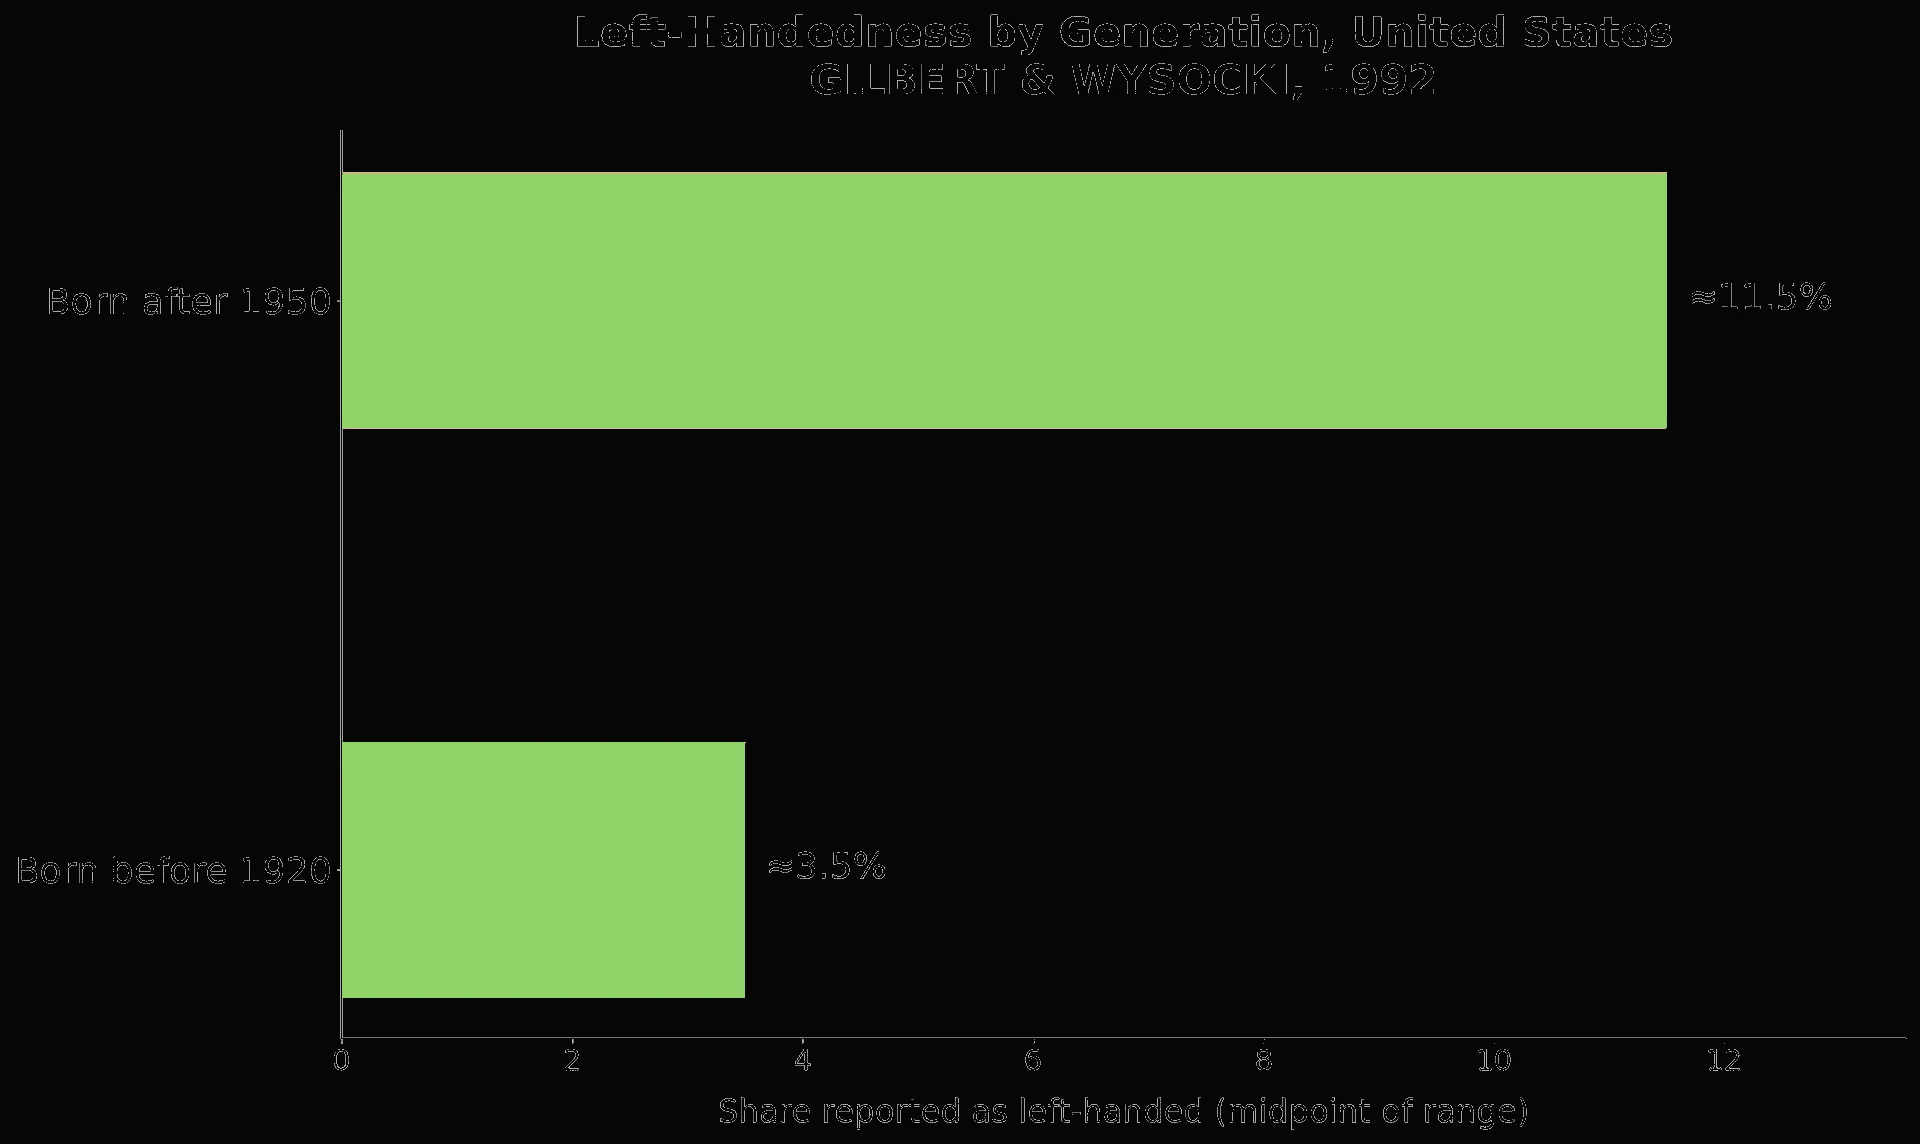
A landmark 1992 survey of over 1.1 million Americans revealed a striking increase in left-handedness over the 20th century. Only 3% to 4% of individuals born before 1920 were recorded as left-handed, compared to 11% to 12% of those born after 1950. This represents a threefold increase in reported left-handedness within a few generations.
Further studies corroborate this trend. One found left-handedness at 15.22% among 21- to 30-year-olds, a figure that dropped to 1.67% in individuals over 80. Correspondingly, the percentage of people who reported switching their writing hand rose from 2.69% in younger cohorts to 6.75% in older ones. This data suggests that the decline in left-handedness among older generations is not due to left-handers dying off, but rather generations of naturally left-handed children being trained to write with their right hand—a practice that largely faded through the 20th century.
Handedness Differences Beyond Geography
Beyond national and generational variations, handedness also exhibits consistent patterns across other demographic lines and contexts.
Sex Differences in Handedness
Large-scale studies consistently show a difference in left-handedness rates between sexes. Approximately 13% of men are left-handed, compared to about 11% of women. This translates to roughly five left-handed men for every four left-handed women. A 2009 study of over 30,000 adults confirmed this pattern, noting its consistency across singletons, twins, and triplets alike. The size of this male-female gap has remained remarkably constant across every generation studied, even as the overall rate of left-handedness has risen sharply.
Twins and Multiples
Research consistently indicates that twins are more likely to be left-handed than singletons. A meta-analysis found that singletons had a 9.5% left-handed rate, while twins and other multiples showed an 11.2% rate. Interestingly, identical twins, who share 100% of their DNA, exhibit almost the same rate as fraternal twins, who share only 50%. Researchers now largely attribute this "twin effect" to the physical stresses of a shared womb and birth, such as lower birth weight, rather than purely genetic factors. Heritability studies estimate the genetic component of handedness at only around 21%.
Left-Handers in Elite Sports
In certain competitive environments, being left-handed can provide a distinct advantage. This is particularly evident in fast-paced, face-to-face, one-on-one sports. For example, in elite table tennis, between 18.64% of female and 25.18% of male top-200 world-ranked players are left-handed. In fencing's épée and foil disciplines, this figure can reach as high as 25.75% among top male athletes. Among professional boxers in 2019, 17.00% of men and 12.50% of women fought in the left-handed "southpaw" stance.
One analysis found that the left-hander rate among elite athletes climbed from 8.7% in low-time-pressure sports to 30.39% in the highest-pressure ones, such as baseball, cricket, and table tennis. Scientists refer to this as the negative frequency-dependent advantage: opponents simply get less practice against a left-handed style because it is rarer. This advantage does not typically extend to sports like tennis, squash, or throwing events, where opponents have more time to adjust during play.
Debunking the Mortality Myth
One of the most persistent claims about left-handedness—that left-handed people die younger—has been largely debunked. A 1991 study initially suggested left-handers died nine years younger, based on comparing average ages of death in a single year. However, critics quickly identified a flaw: because left-handedness rates were rapidly increasing across generations, the left-handers in that sample year were, on average, simply younger people. Subsequent research, including a study of Danish twins, found no survival difference between left- and right-handed siblings.
A 1993 study tracking 5,500 cricketers, a fixed group with reliable handedness records, also found no mortality gap between left- and right-handed players, firmly shifting scientific consensus away from this claim.
Key takeaways
- The Netherlands has the highest rate of left-handedness globally (12.95%), while China has the lowest (2.64%), demonstrating a significant cultural influence on handedness.
- All five least left-handed nations are in Asia, attributed to cultural pressures for conformity and historical practices of training children to be right-handed.
- Reported left-handedness rates in the US nearly quadrupled from pre-1920 (3-4%) to post-1950 (11-12%) birth cohorts, reflecting a decline in societal correction of natural handedness.
- Men are consistently more likely to be left-handed than women, with approximately 13% of men and 11% of women identifying as left-handed.
- Left-handers exhibit a distinct advantage in fast, one-on-one sports due to opponents having less practice against their rarer style, a phenomenon known as negative frequency-dependent advantage.
- The claim that left-handers die younger has been scientifically debunked, with studies showing no significant mortality difference between left- and right-handed individuals.
Disclaimer: This article provides general information based on population studies and is not intended as professional advice.
Compare jurisdictions with TERRA AI
Statistics about where people live are only half the decision. If you are building an online business or choosing tax residency deliberately, TERRA AI compares Stacks by tax treatment, regulatory burden, sovereignty, and values — then connects you with licensed attorneys and advisors who execute.
This article is general information only and is not legal or tax advice. Consult a licensed professional in your jurisdiction before acting on residency, incorporation, or tax topics.