 Shadow
 Global Meeting Loads: Where Workers Spend the Least Time in Meetings
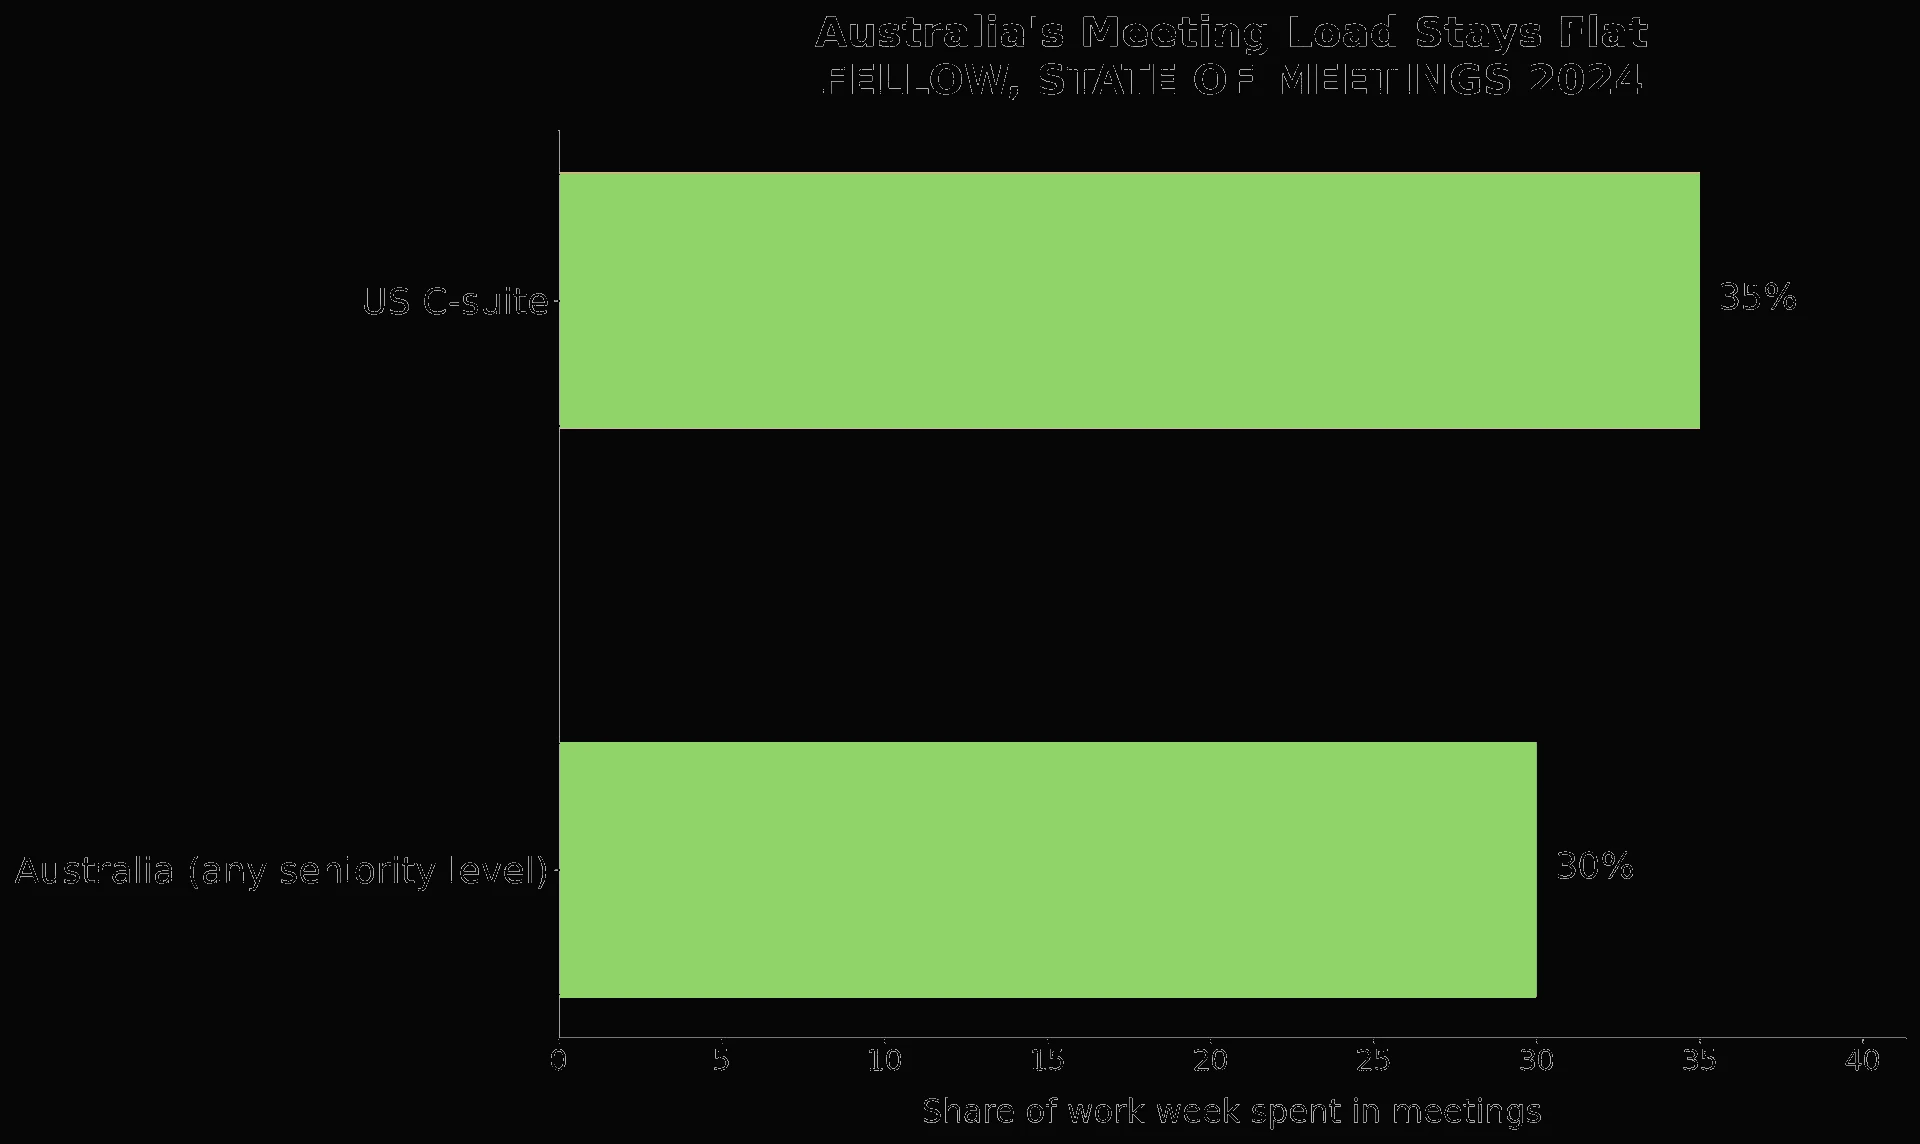
Australian workers across all seniority levels spend no more than 30% of their week in meetings, while Canadian executives face the highest load at 36%.

Meeting loads vary significantly across global workplaces, with one country's senior leaders dedicating 36% of their week to meetings, while another ensures no worker, regardless of seniority, exceeds 30%. This disparity highlights diverse approaches to collaboration and efficiency in the modern work environment.
Global Disparities in Meeting Time
The amount of time workers spend in meetings varies dramatically based on their location and organizational structure. Data from Fellow's 2024 State of Meetings report, which analyzed over 30,000 organizations, reveals a significant gap between the most and least meeting-heavy workplaces.
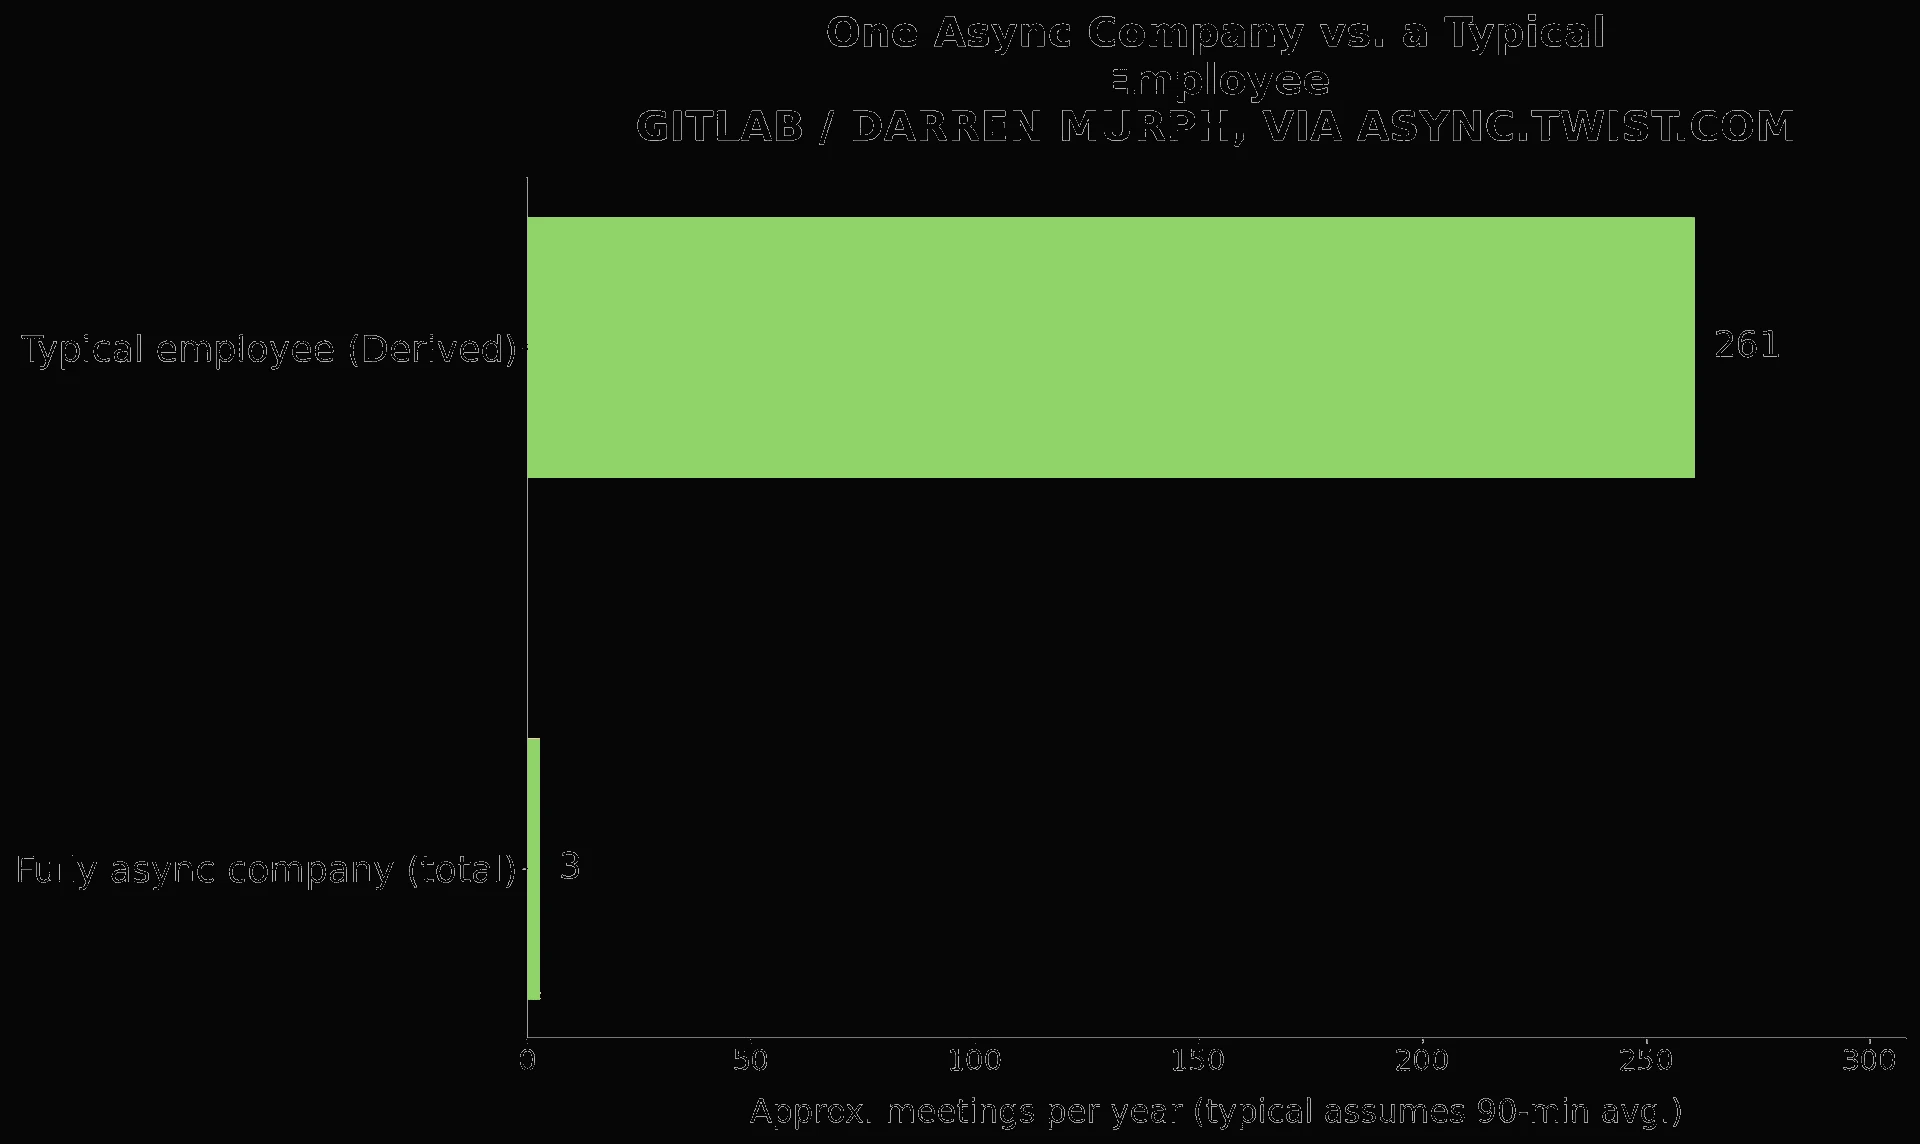
While some senior leaders globally spend more than a third of their week in scheduled calls, certain remote-first companies with over a thousand employees manage to operate with only a handful of company-wide meetings per year. This spectrum underscores the diverse strategies organizations employ to manage collaboration and information flow.
Countries with the Least and Most Meeting Hours
Australia stands out for its relatively low and consistent meeting load across all seniority levels. No worker in Australia, from individual contributors to the C-suite, spends more than 30% of their week in meetings. This flat curve is unique among the regions studied, where meeting time typically escalates with seniority.
In contrast, the United States records the highest percentage of weekly meeting time across every seniority level among the countries analyzed. US employees spend at least 20% of their week in meetings, a figure that climbs to 35% for senior leaders. Canada's C-suite surpasses even this, with executives spending 36% of their week in meetings, marking the highest individual figure in the report.
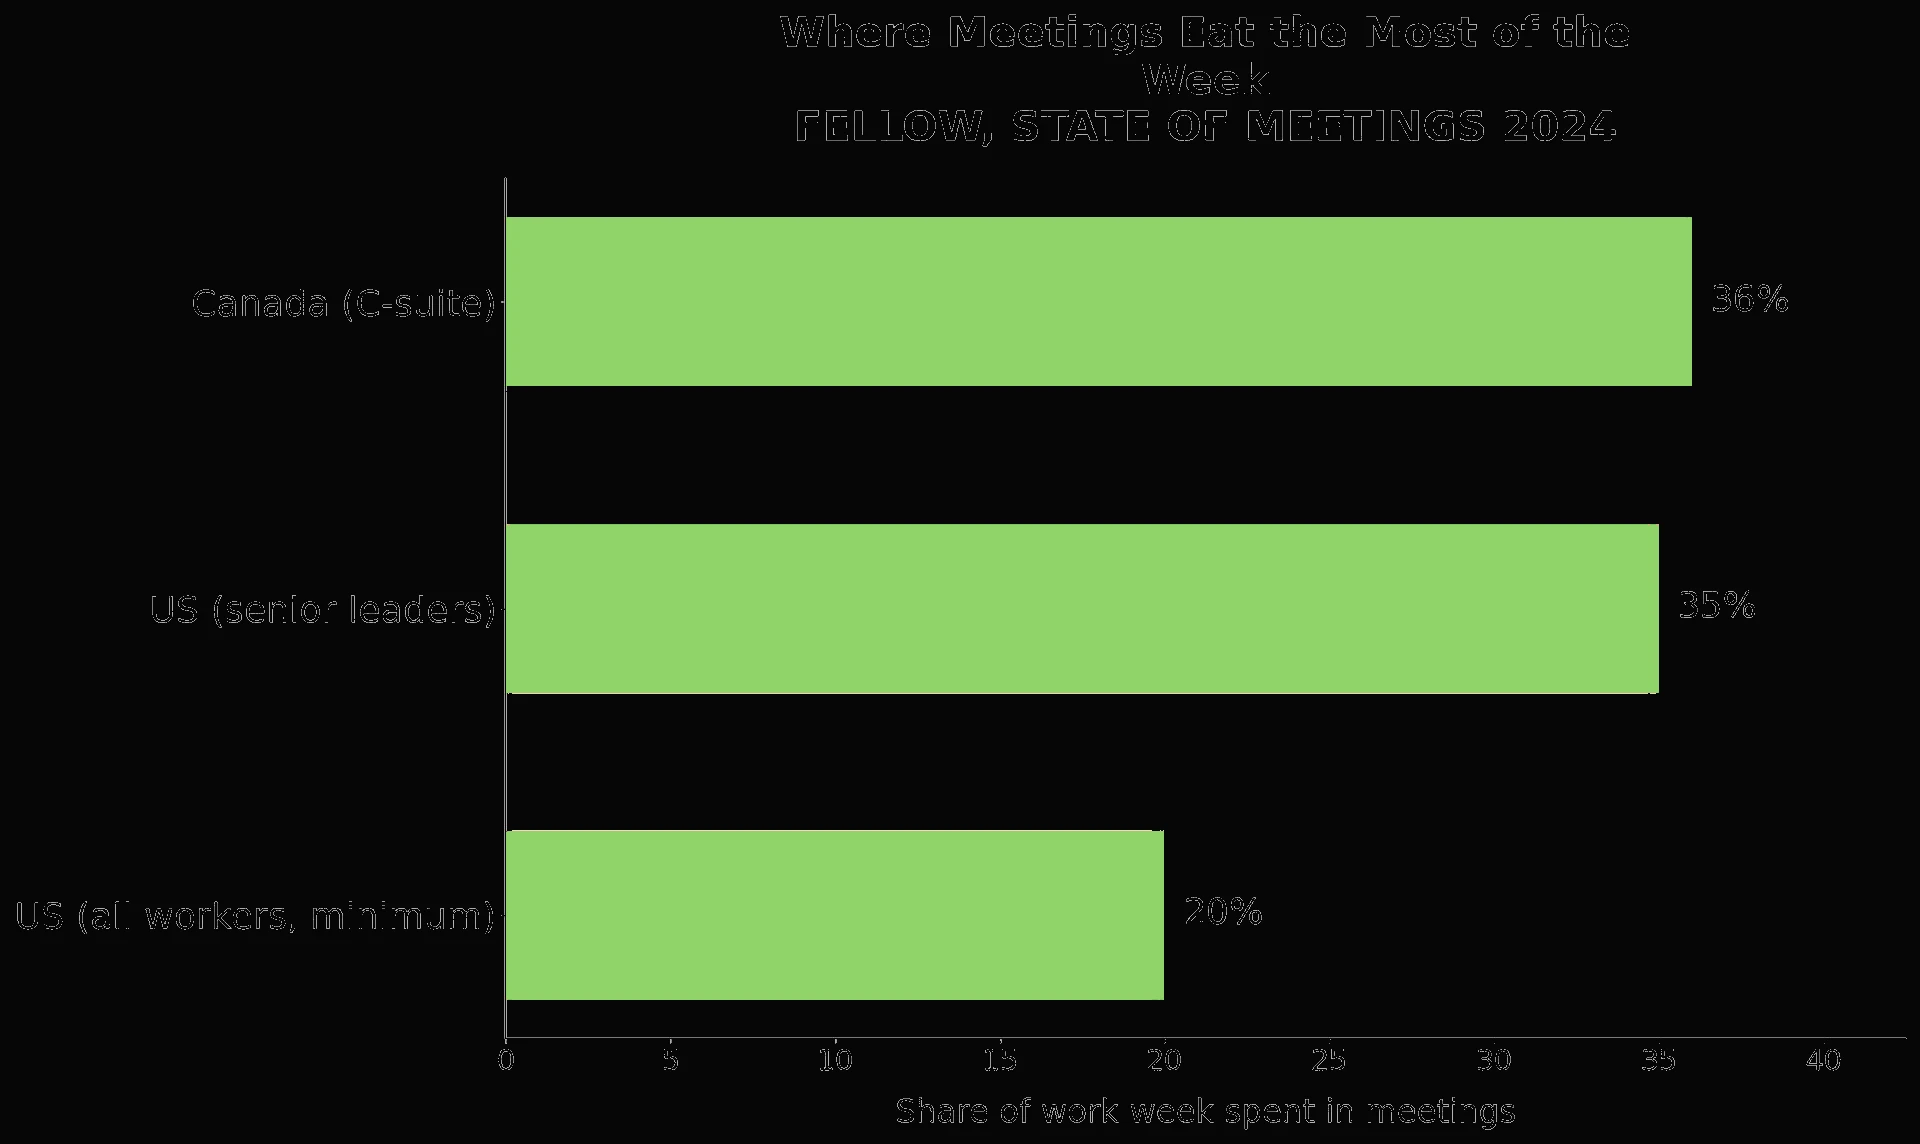
The disparity is significant: a Canadian executive and an Australian individual contributor, despite their different roles, can experience vastly different shares of their working life consumed by meetings. Other countries like the UK, Germany, France, Netherlands, and Singapore also show varying meeting loads, generally falling between Australia's low figures and the higher percentages seen in the US and Canada.
The Impact of Company Size on Meeting Schedules
Beyond national averages, company size emerges as a dominant factor influencing meeting frequency. As a company scales from fewer than 10 employees to over 1,000, the meeting load for individual contributors increases by only 4 percentage points. However, for vice presidents and C-suite leaders, this growth more than doubles their meeting time.
Once an organization exceeds 200 employees, the meeting burden becomes substantial:
- Individual contributors spend 20% of their time in meetings.
- Managers dedicate 25% of their week to meetings.
- Senior leaders face 40% or more of their week in meetings.
This suggests that joining a smaller company can be a more effective strategy for reducing meeting time than selecting a specific country to work in.
The Near-Elimination of Meetings: GitLab's Model
Some organizations have pushed the boundaries of meeting reduction. GitLab, an all-remote company with over 1,600 employees spread across 60-plus countries, operates with minimal live meetings. Its extensive public handbook, spanning over 2,000 printed pages, serves as a comprehensive, searchable source of truth, replacing many discussions that would otherwise require synchronous calls.
Darren Murph, GitLab's former Head of Remote, described a previous fully asynchronous organization he led as holding only two to three company-wide meetings annually. This model emphasizes asynchronous communication and documentation as primary modes of collaboration, a trend worth watching for companies seeking to reduce meeting overhead.
Cultural Approaches to Meeting Efficiency
Japan presents a distinct cultural model for managing meetings through a practice known as nemawashi. This involves informal, one-on-one conversations designed to build consensus among stakeholders before any formal decision is brought to a group setting. This groundwork ensures that by the time a formal meeting or proposal (a ringisho) circulates through the ringi system for written approval, most disagreements have already been resolved privately.
While this process may appear slow initially, as it allows for weeks of private discussion to address real disagreements, it ultimately leads to faster execution once consensus is achieved. The formal meeting itself often becomes a mere formality, with no further discussions needed to settle disputes. This approach highlights that meeting efficiency isn't always about holding fewer meetings, but about shifting the substantive discussions out of the meeting room.
The Economic Burden and AI Solutions for Meetings
The sheer volume of meeting time across the global workforce carries a significant economic cost. The average employee spends 392 hours annually in meetings, equivalent to more than 16 full working days. Factoring in salary time, this meeting burden costs an estimated $29,000 per employee per year.
While 90% of workers keep their meeting load under 10 hours a week, a small but significant fraction—about 2%—regularly exceed 20 hours, effectively spending half their working week solely in meetings. This gap between typical and heavy meeting attendees is comparable to the difference between a part-time and full-time job, with the "job" being meetings themselves.
However, technology is beginning to reshape this landscape. Companies implementing default meeting recording and AI summarization tools have reported a 20–40% reduction in meeting length within six months. Furthermore, teams utilizing AI-generated meeting notes see action-item completion rates climb from the 50–60% range to an impressive 85–95%.
Without effective follow-up, 70% of meeting decisions are forgotten within 24 hours. AI tools address this structural problem by creating searchable records, reducing the need for live attendance to stay informed, and improving accountability.
Key takeaways
- Australia maintains the lowest and most consistent meeting load across all seniority levels, with no worker exceeding 30% of their week in meetings.
- The US and Canada's C-suite leaders face the highest meeting burdens, with Canadian executives spending up to 36% of their week in meetings.
- Company size is a more significant predictor of meeting load than country, with larger companies imposing substantially more meeting time on senior leaders.
- Companies like GitLab demonstrate that extensive documentation and asynchronous communication can nearly eliminate the need for live meetings, even for large, globally distributed teams.
- Japanese business culture uses nemawashi to build consensus before formal meetings, shifting disagreement resolution out of the meeting room.
- Meetings cost an estimated $29,000 per employee annually, but AI tools are proving effective in reducing meeting length and improving action-item completion rates from 60% to over 90%.
Disclaimer: This article provides general information based on the World Population Review newsletter and is not intended as legal, financial, or tax advice. For specific guidance, consult with qualified professionals. The mention of New York in the source refers to the newsletter's mailing address and is not a data point on meeting loads.
Compare jurisdictions with TERRA AI
Statistics about where people live are only half the decision. If you are building an online business or choosing tax residency deliberately, TERRA AI compares Stacks by tax treatment, regulatory burden, sovereignty, and values — then connects you with licensed attorneys and advisors who execute.
This article is general information only and is not legal or tax advice. Consult a licensed professional in your jurisdiction before acting on residency, incorporation, or tax topics.