 Shadow
 Global Job Satisfaction: High Pay Doesn't Guarantee Happiness
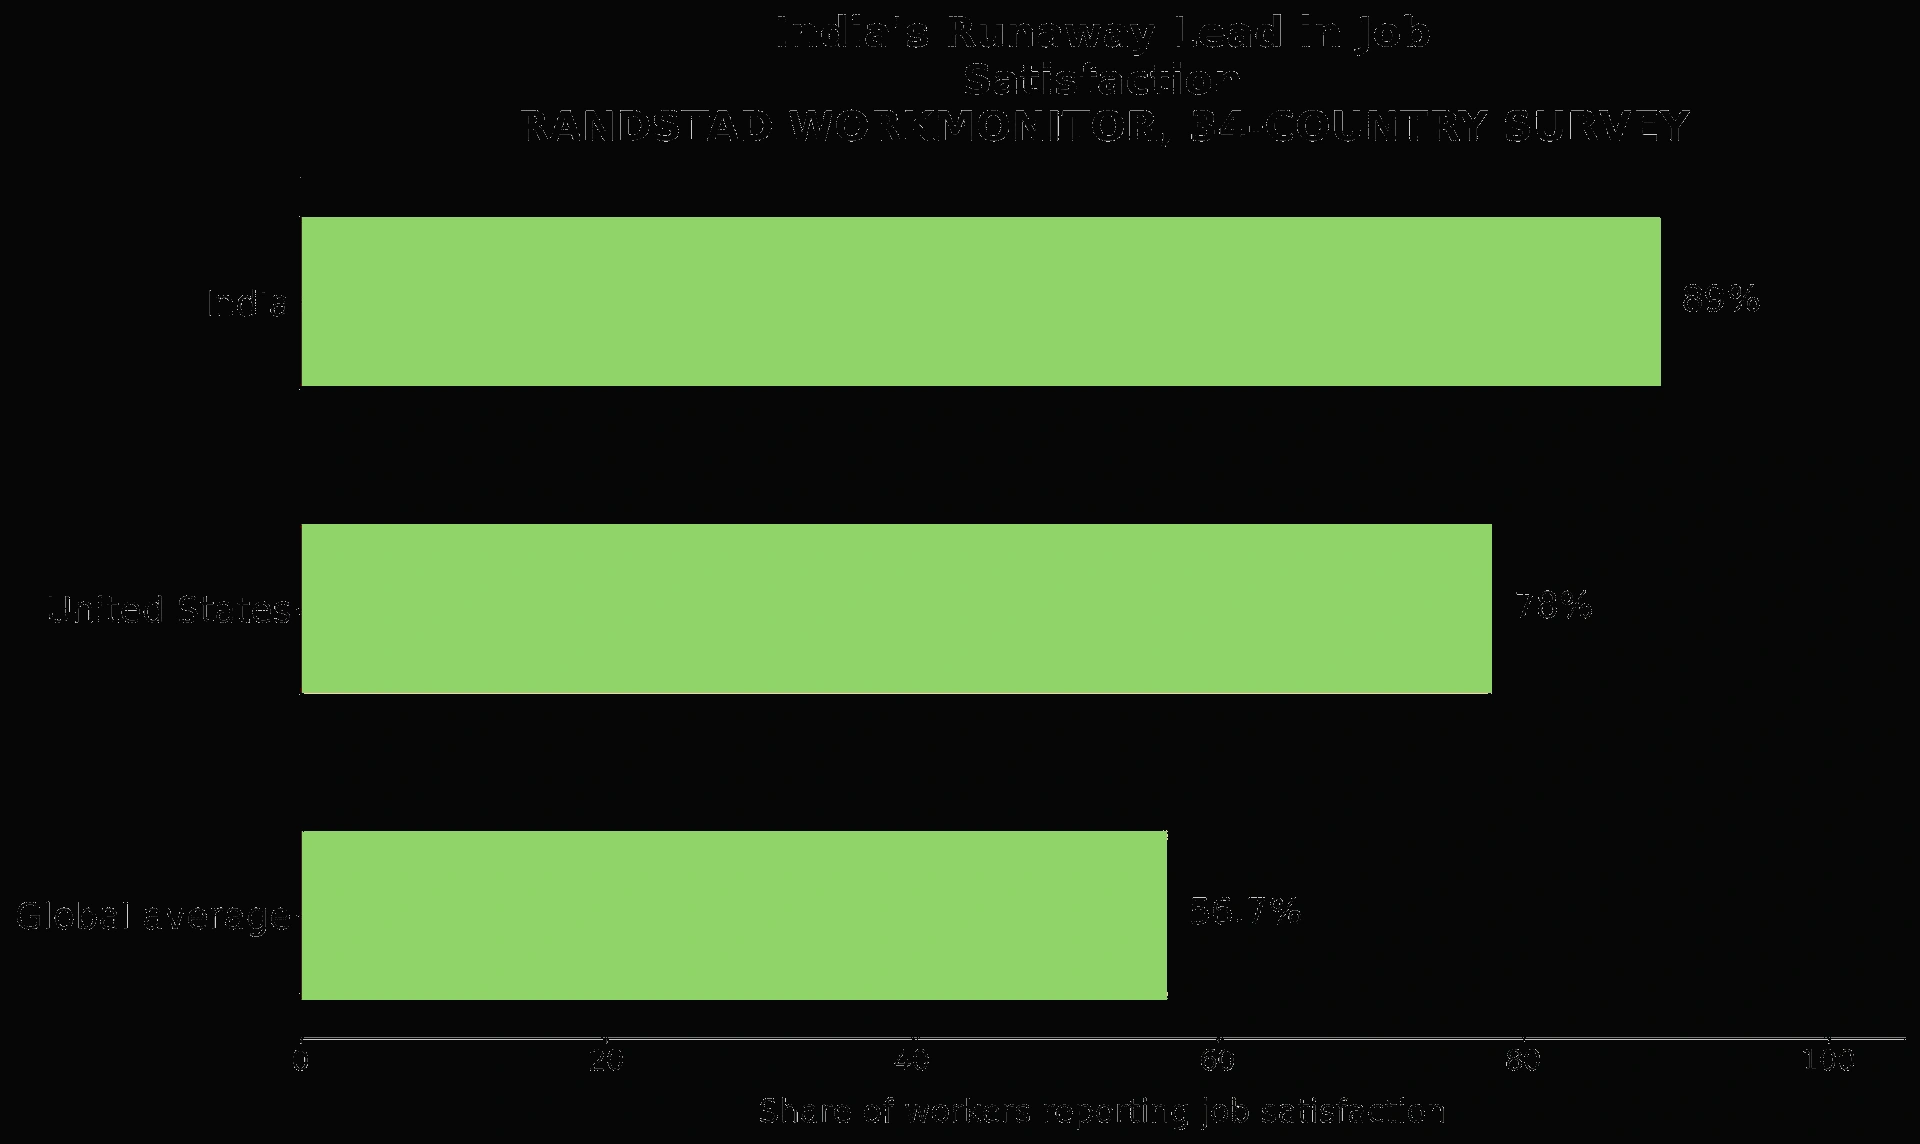
India leads global job satisfaction at 89%, significantly above the 56.7% global average, while Japan ranks lowest at 42%.

Job satisfaction varies significantly across the globe, with India reporting the highest rate at 89%, far exceeding the 56.7% global average. This finding challenges the assumption that economic prosperity directly correlates with workforce happiness, as some of the wealthiest nations rank among the least satisfied.
Global Job Satisfaction Rankings
A Randstad Workmonitor survey across 34 countries reveals stark differences in job satisfaction. India stands out with an 89% satisfaction rate, more than 30 percentage points higher than the global average of 56.7%. This lead is notable given India's GDP per capita is a fraction of many wealthier nations.
The United States ranks within the top five globally, with 78% of workers reporting satisfaction. This places the US comfortably above the global average, though still behind India's leading position.
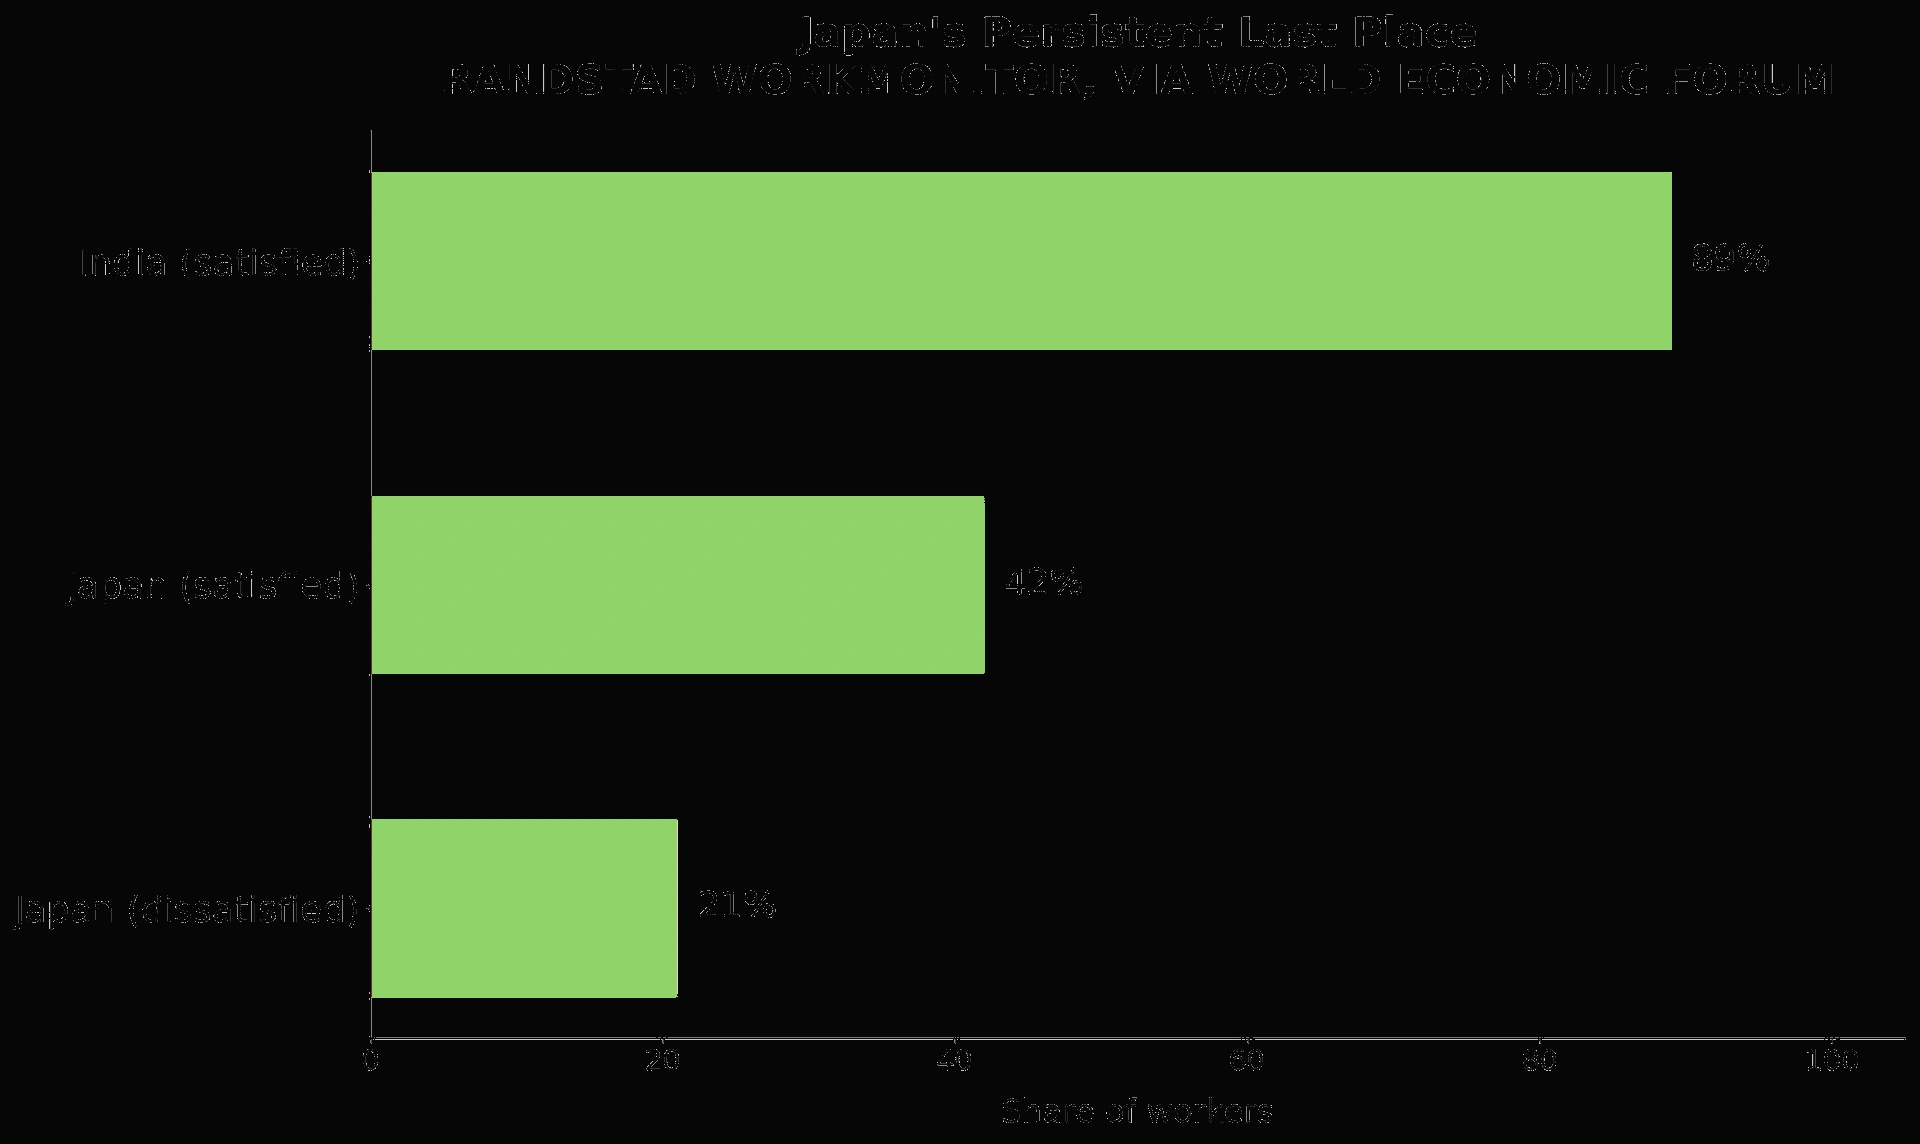
Conversely, Japan records the lowest job satisfaction among the 34 countries surveyed, at just 42%. This also corresponds to the highest dissatisfaction rate in the survey, at 21%. Japanese workers report dissatisfaction at approximately seven times the rate found in India, a consistent trend observed across multiple international workplace studies.
European Union Variations
Within the European Union, job satisfaction varies sharply:
- Malta: Posts the highest professional optimism in the EU, partly due to a strong tech sector with many remote workers for foreign employers.
- Portugal: Has the lowest job satisfaction in the entire European Union.
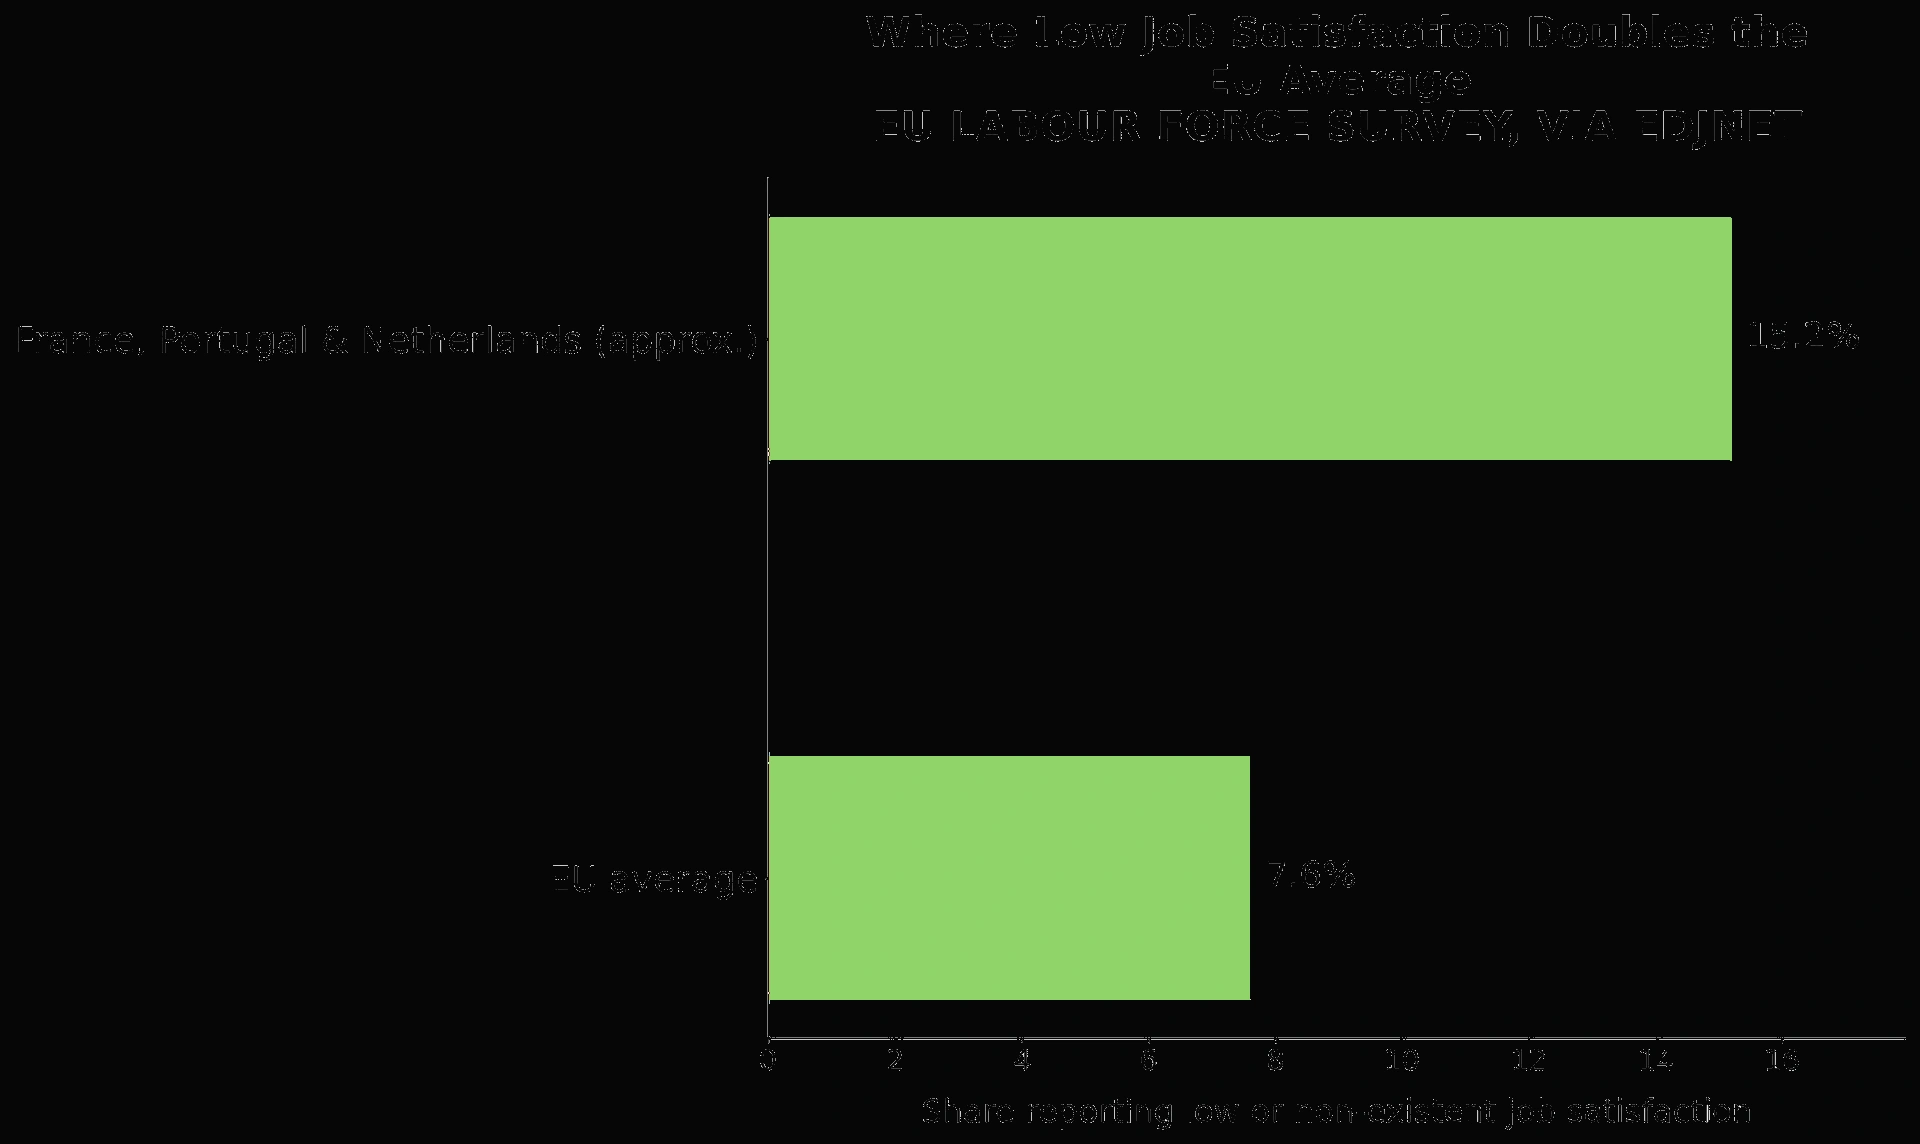
- France, Portugal, and the Netherlands: These countries see low or non-existent job satisfaction roughly double the EU average of 7.6%.
Most EU countries have seen job satisfaction improve since 2017, with Portugal being one of the few exceptions where the trend is moving in the opposite direction.
When Fewer Days Meant Happier Workers Everywhere
Several countries and companies have experimented with shorter workweeks, yielding positive results for worker well-being and productivity. Iceland conducted two large-scale trials between 2015 and 2019, reducing work hours to 35–36 per week for 2,500 public-sector employees without a pay cut. These trials were deemed an "overwhelming success."
Key outcomes from Iceland's trials:
- Worker well-being improved across stress, burnout, and general health.
- Productivity remained stable or improved in most workplaces.
- By 2022, 86% of Iceland's workforce had the option for reduced hours with the same pay.
- 51% of eligible workers had adopted the reduced hours.
Iceland's productivity has grown faster than other Nordic countries since the trials, challenging concerns that shorter hours would lead to economic costs.
Global Shorter Workweek Trials
Similar four-day week trials in other regions produced consistent positive results:
- Microsoft Japan: A four-day week trial resulted in productivity rising by nearly 40%. Electricity costs fell by 23%, and printing dropped almost 60%.
- United Kingdom: The world's largest trial saw 92% of participating companies choose to continue with the four-day model after the pilot concluded.
- North America: A separate pilot recorded average employee satisfaction scores increasing from 6.7 out of 10 to 8.9 out of 10.
Across diverse countries and industries, cutting a workday from the week has consistently improved worker satisfaction and productivity, defying initial employer fears of a collapse in output.
Engagement Is Falling Even Where Satisfaction Holds Steady
Job satisfaction and genuine employee engagement are distinct metrics, and global engagement levels are declining. According to Gallup's State of the Global Workplace 2025 report, global employee engagement fell to 21% in 2024, tying for the lowest level since the pandemic began.
Regional engagement rates:
- United States and Canada: Posted the highest regional engagement at 31%.
- Europe: Recorded the lowest engagement at just 13%.
This decline in engagement cost the global economy an estimated $438 billion in lost productivity in a single year. The drop was primarily driven by falling engagement among managers rather than individual workers. A worker can report broad job satisfaction while still being disengaged, stressed, or merely going through the motions according to more detailed engagement metrics.
Thriving at Work Is Rarer Than Satisfaction Suggests
Beyond satisfaction and engagement, Gallup's "thriving" metric measures overall life evaluation. In 2024, only 33% of workers globally rated their lives as thriving, a decrease from 35% two years prior.
Workers in the US and Canada reported the highest thriving rate of any region, at 52%. However, even this figure saw a four-percentage-point drop in a single year. Half of genuinely engaged employees describe themselves as thriving, compared with only one-third of those who are merely "not engaged."
The data indicates that satisfaction, engagement, and thriving are three distinct measures that often do not align. A country can lead in one metric while lagging significantly in another, highlighting the complexity of workforce well-being. Job satisfaction does not consistently track with wealth, hours worked, or even general happiness rankings.
Key takeaways
- India leads global job satisfaction at 89%, significantly higher than the 56.7% global average, despite having a modest GDP per capita.
- Japan ranks lowest in job satisfaction at 42%, indicating a disconnect between economic prosperity and workforce happiness.
- Shorter workweek trials in Iceland, Microsoft Japan, and the UK consistently improved worker well-being and productivity without economic cost.
- Global employee engagement fell to 21% in 2024, costing the global economy an estimated $438 billion in lost productivity.
- The US and Canada show higher rates of both engagement (31%) and thriving (52%) compared to other regions, though their thriving rate declined by four percentage points in one year.
Disclaimer: This article provides general information based on survey data and is not intended as legal, financial, or tax advice. Consult with qualified professionals for specific guidance.
Compare jurisdictions with TERRA AI
Statistics about where people live are only half the decision. If you are building an online business or choosing tax residency deliberately, TERRA AI compares Stacks by tax treatment, regulatory burden, sovereignty, and values — then connects you with licensed attorneys and advisors who execute.
This article is general information only and is not legal or tax advice. Consult a licensed professional in your jurisdiction before acting on residency, incorporation, or tax topics.